
This post was inspired by a really educational and fun documentary series on Netflix called Connected. If you're not a math buff don't worry, neither am I! Let's look at Benford's Law and whether or not it applies to my code.
Benfords Law
I could try and explain Benford's Law myself, but really Wikipedia does a great job of this, and so does Connected. However in short it goes like this:
Benford's Law describes the distribution of the first digit of each number in a given series of numbers. For example numbers that begin with the digit 1 (e.g. 1, 10, 11, 100) would make up approximately 30% of the numbers of a given series. Numbers starting with 2 will be approximately 17% of that series and so on.
While this is cool on its own what really blew me away was how many things this can be applied to. I don't want to spoil Connected if you want to watch it (Episode 4 Digits, for those of you wondering), but we see it spread across a large number of domains from natural formations to populations and even music.
The thing with documentaries is that they sometimes only show the cases where it does work, and so their assertion that is really can be found "everywhere" is a little misleading. Regardless I was inspired to see if I could find it in my own everyday life. As a programmer what better opportunity to write some code and perhaps even analyze my own code?
The Test
My test was fairly simple. If I count the number of characters on a given line in a file that contains code does the distribution of the first digit of those lengths adhere to Benford's Law?
In an effort to keep this somewhat low effort and also to take a snapshot of code I work on daily I simply surveyed all the repositories I had cloned locally on my own computer. I only survey the actual code (typically the src directory) and also filtered out files that were not plain text.
For a typical c# project that meant only *.cs files. For an Angular project that would mean *.ts, *.html and *.scss and so on. I also stripped any lines that had a length of 0 as they aren't counted in the distribution.
What makes my particular use case interesting is that I have some extremely large projects that I work on (many thousands of lines of code) and I also have very, very small personal projects. These repositories span a number of languages mainly c#, TypeScript, JavaScript, HTML, css or some combination thereof. Some use extra frameworks like Angular or React, some use Unity. It's a decent cross section of content without me going onto Github and scraping a larger data set. I actually sort of want to do that (scrape Github) at some point because my results were pretty cool 😎.
Overall I sampled only 14 projects but even with this relatively small data set trends very quickly emerge.
The Results
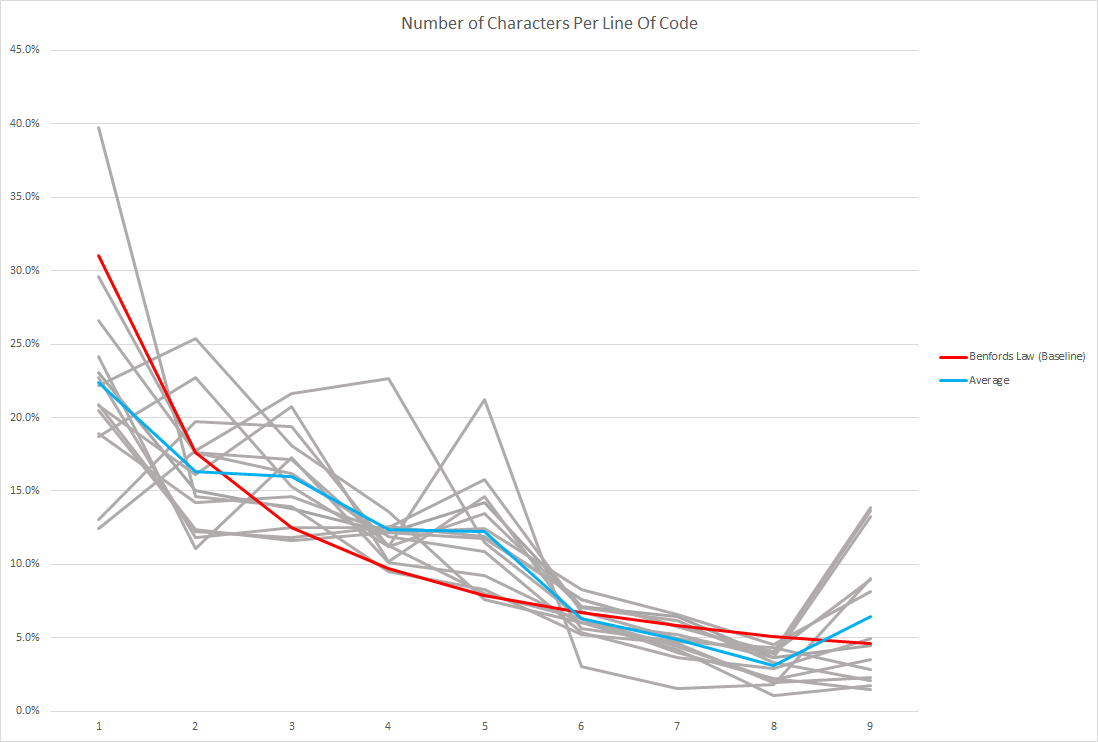
If we plot all 14 projects (as seen in grey) below it seems rather chaotic when compared to the red line that is Benford's Law. However if we take the average of those values things actually start looking pretty good...
Because that is starting to look a little messy lets remove all the noise and just focus on Benford's Law vs the average length of a line.
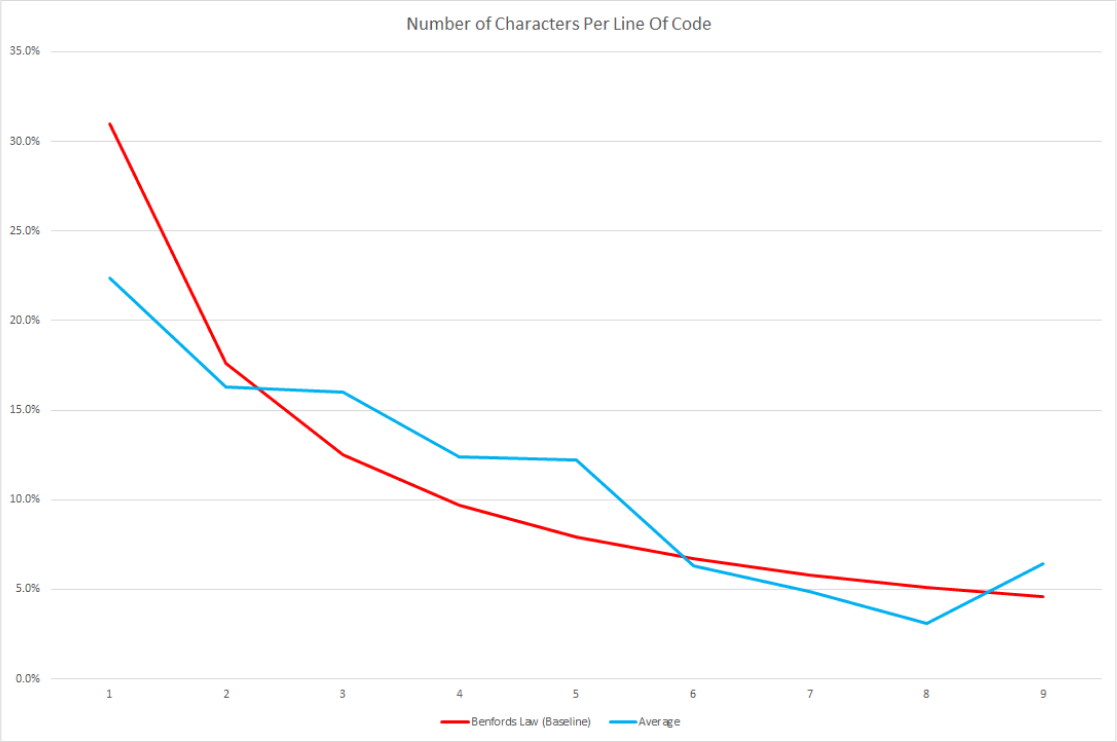
We can definitely see a trend here and using all the scientific rigor I can muster I have decided to label these results as somewhat-benfordian. There's definitely something going on here but the results are skewed much further to the middle of the data set than I would have expected.
Going Full Benford
Knowing that I had a lot of really small projects (and a small data-set as well) I figured there might be a lot of unnecessary noise in my results. So what if I just focused on the 5 extremely large projects I have on my local machine that are likely more representative of "real world" applications (because they are real world applications)?
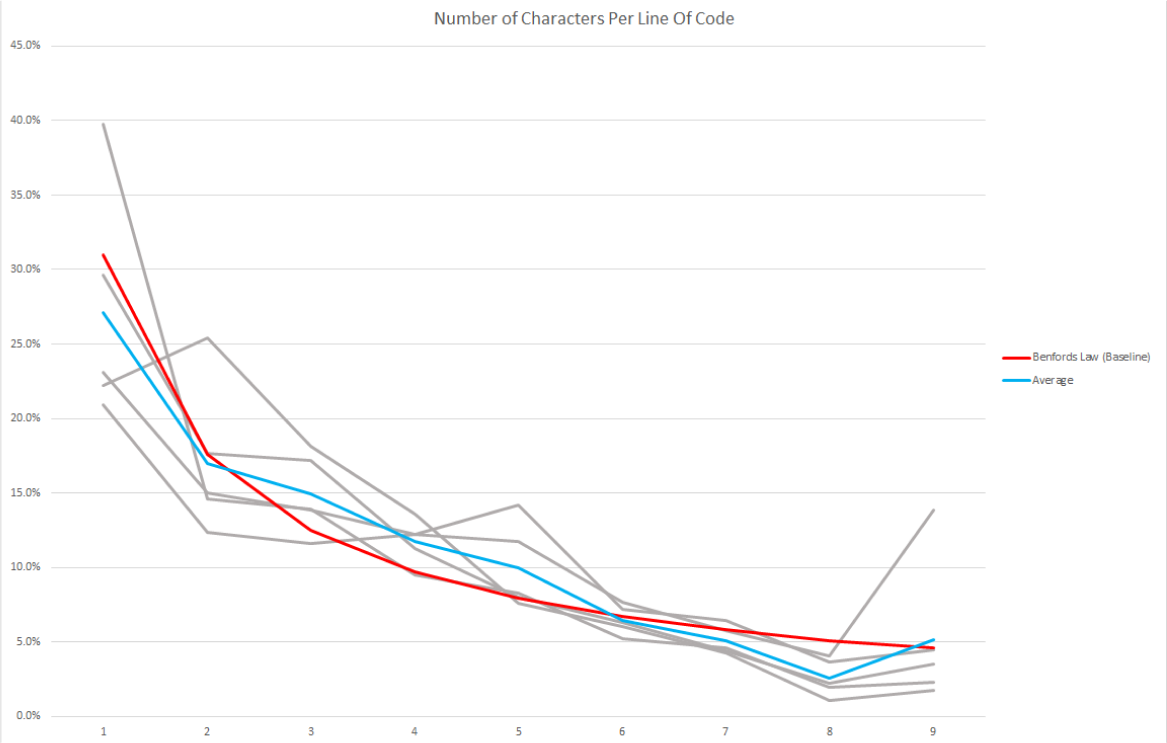
These results look much less noisy. Still a few outliers here and there but strangely it looks like my code exhibits the same sort of distribution that is seemingly found...everywhere?! To be consistent lets look at Benford's Law just against our average.
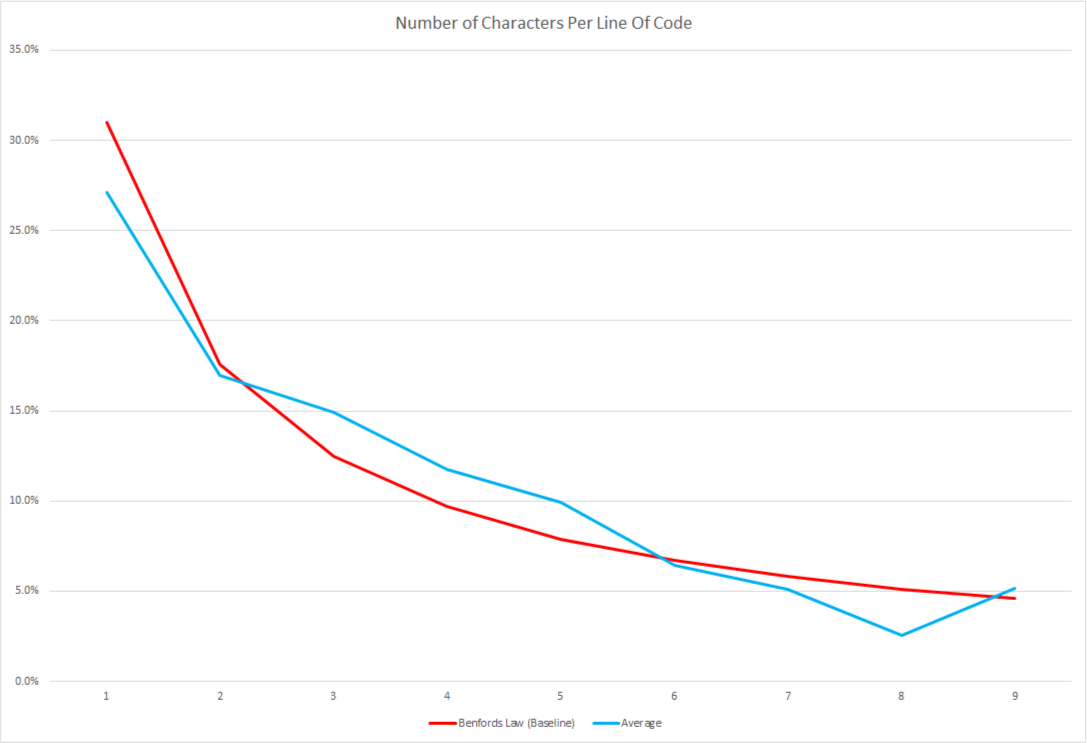
Woah, pretty cool! Putting on my tweed suit and getting out my slide-rule I can say that these results are very-benfordian.
Closing Thoughts
It seems like Benford's Law truly does manifest everywhere! This was such a simple and quick test to do, even such a basic test here revealed that on an ad-hoc set of data there was a trend towards a Benfordian distribution when considering the average line length across all my repositories.
I hypothesize that the larger the code base, or the larger the set of code bases the more likely the distribution will conform to Benford's Law. Maybe when I have a bit more time I can sample a wider cross section of programming languages. I would love to see how a language like Python, that relies on white space and doesn't have as many braces, effects the distribution.
I think that if a show like Connected can sit with me for days after I have finished watching the episode and prompt me to become a mini-scientist for the morning then there is something really valuable to that show in both it's educational outcomes and it's overall design and presentation.
Who knows maybe this will prompt me to find more of Benford's Law in my day-to-day life?